GIS Portal
SRAP’s GIS Portal was created to help communities understand the damaging impacts of industrial livestock production by providing insight into geographic characteristics, demographic trends, and patterns of pollution. The Portal compiles publicly available data and map layers from government, academic, and other sources to provide a one-stop mapping resource for advocates and communities facing industrial livestock operations.
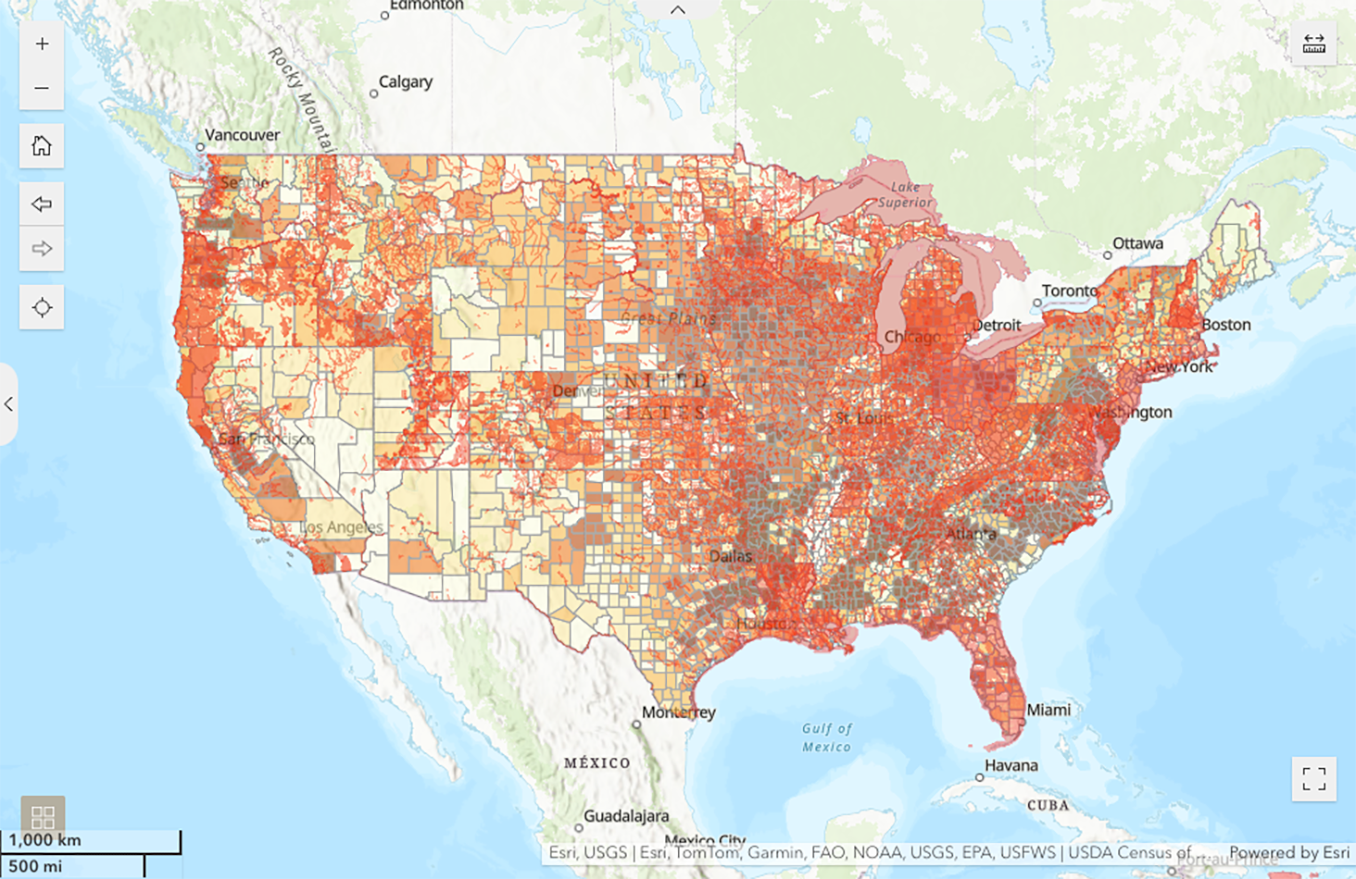
The Portal includes national GIS layers along with state-specific GIS layers for the states listed below.
See our layer description page for more information about each layer.
How to Use the Portal
Measurement Tool ![]()
The Measurement widget calculates distances, perimeters, and areas in web maps and web scenes. Experience Builder uses the ellipsoid-based geodesic calculation to calculate measurements. You can:
- Estimate horizontal distances;
- Understand distances and areas; and,
- Quickly draw outlines over parcels to estimate their areas and perimeters.
Distance ![]()
Measure a linear distance. Click the map where you want to start the measurement and click once for every vertex of the line you want to measure. Double-click to complete the line.
Area![]()
Measure an area and its perimeter. Click the map where you want to start the measurement and click once for every vertex of the area you want to measure. Double-click to complete the area.
Near Me Tool
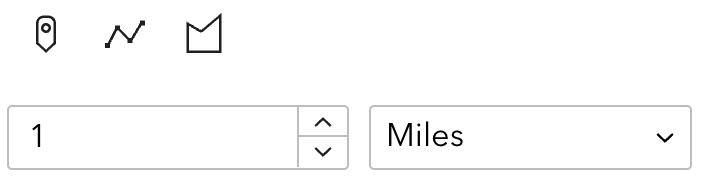
The Near Me widget allows you to find and analyze features within a specified distance of a defined location.
- Drop a pin to learn what features are within a determined buffer area;
- Draw a line to find features within a linear area;
- Draw a polygon to find features within an area with more than two points;
- See the tutorial video for a short demonstration.
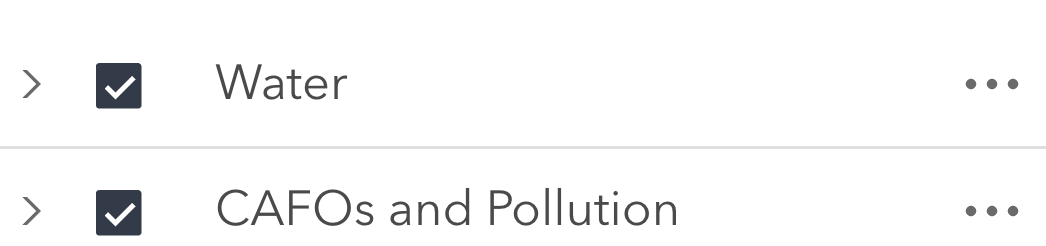
Map Layers
- Zoom to: Include the Zoom to button for each layer;
- Show or hide labels: For layers with labels, allow users to show or hide labels;
- Transparency: Allow users to change the transparencies of layers in the connected map;
- View layer details: Include the Details button;
- Use tick boxes to control layer visibility: Include tick boxes that allow users to turn layer visibility on or off in the connected map.
Base Map Gallery ![]()
The base map gallery includes a variety of choices, including topography, imagery, and streets.
Print Maps
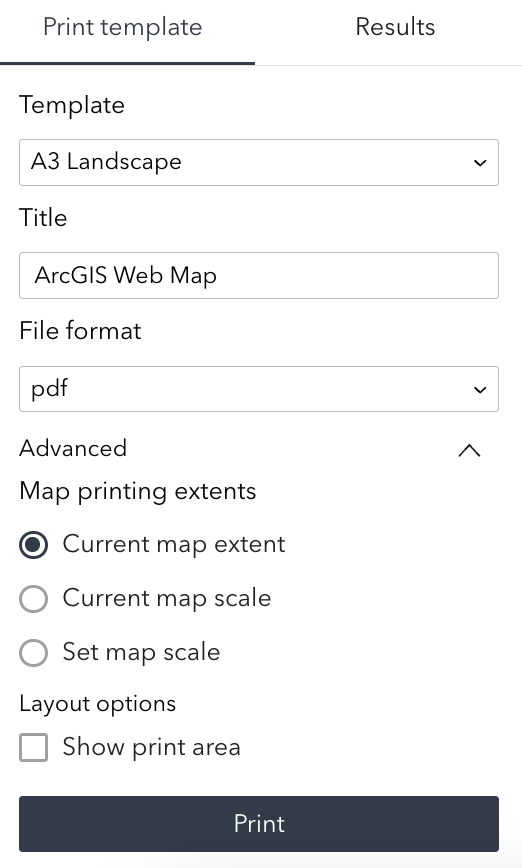
- Title: Specify the printed file name and the map title when applicable;
- Map printing extents: Choose how to calculate the map's printed extent;
- Current map extent: Use the Map widget's current view;
- Current map scale: Use the Map widget's current scale;
- Set map scale: Provide an exact scale;
- See the tutorial video for a short demonstration.
About SRAP
Through education, advocacy, and organizing, Socially Responsible Agriculture Project collaborates with communities to protect public health, environmental quality, and local economies from the damaging impacts of industrial livestock production and to advocate for a socially responsible food future.